

Description

Description
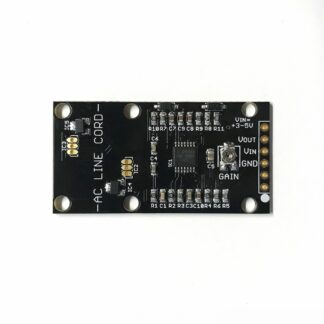
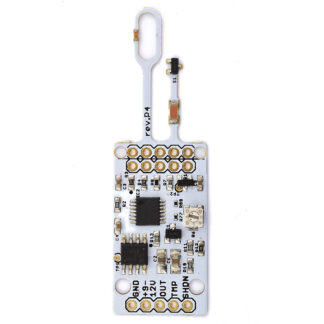
The wind sensor is the latest revision of our wind sensors. The revision is mainly a fine-tuning for stability and accuracy. We have also added a potentiometer to simplify the calibration of your board. Adjust them in the shop. The pots should not be user items, unless the user wants to try them out in practice. We will also do a new regression and revise the code to support the sensors.
The wind sensor is an improved hot-wire anemometer that includes hardware compensation for ambient temperature. The sensor is somewhat arbitrary, but can also represent a positive temperature coefficient thermistor. The thermistor used in this model is more stable and absolutely accurate than the thermistors in other sensors. As in all cases of engineering, there are good and bad sides to a new thermistor. As it is not possible to buy thermistors in arbitrary values, a higher voltage is required to heat the sensing element to operating temperature. Therefore, the sensor needs a power supply of 9 to 12 volts.
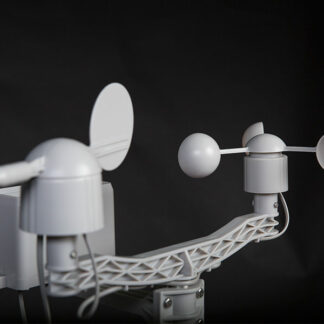
One pleasant side effect of the increased voltage is that the sensor can sense hurricane-force winds without saturating (reaching a flat maximum) because there is enough power to heat the thermistor. However, this does not necessarily mean that the sensor can withstand hurricane-force winds. The sensor has to be physically more robust than previous sensors due to the loop that holds the sensing element. Another new feature of the sensor is a dedicated ambient temperature sensor that is independent of the supply voltage. The analogue output of the temperature sensor is also scaled to 3.3 volts. The voltage (wind) output of the sensor is also scaled to a maximum of 3.3 volts output with high accuracy (0.1% resistance). This is to accommodate the increasing use of 3.3 volt boards and microcontrollers. Apart from the fact that you need to supply at least 9-12 volts from an external power supply, it will work well with any board right out of the box. 12 volts is ideal.
Specifications
Supply voltage: 10-12 volts
Current: ~40mA – increases slightly as wind speed increases
Measured wind speed: 0-150 MPH
Ambient temperature compensation

Calibration of the wind sensor from a new regression
We have reprocessed the old data and added a software temperature correction for the wind sensor. The sensor itself has a built-in hardware temperature calibration, but the hardware correction is not perfect.

From these trend lines on this graph of ADC units and static pressure, it can be seen that the curves diverge slightly at the top of the graph. Using the static pressure data from the pitot tube and the humidity and temperature data, the pitot tube data was converted to wind speed. We then set up a regression and derived an equation that matched the sensor curve.
The regression was performed by finding the output voltage instead of the wind speed. When the regression was done, it was necessary to factor the final equation solving for the wind speed (in MPH) instead of the volts, the output of the sensor. This made the calculations a little less straightforward than if the regression had been done the other way round.
Solver!

To show you the inspirational workings of the Excel solver, have a look at the data on the left. The two columns on the left-hand side show the actual measured voltage values in one column and the values calculated from the generated equations in the other column. The third column on the far right is the difference between the two columns squared to remove the minus sign. As you can see, the two columns agree very well with each other, confirming that the equations produce a curve that is very close to the curve actually produced by the sensor. The wind speeds in the data ranged from zero to about 50 MPH.
Incidentally, these errors are the way the solver actually works. The solver tries to minimise the total error for all temperature series by manipulating the constants in the equations below (there were four temperature data points spanning 7.7C).
Of course, there is always the possibility that over a wide range of data the equation will lose its form and the curve will start to diverge from the actual measured data. In that case, a more sophisticated capability to obtain the actual shape of all the data would require the introduction of an equation with more terms.
The equations derived from the regression of the wind sensor are as follows
WS_MPH =(((Volts – ZeroWind_V)/(3.038517 *(Temp_C ^ 0.115157)))/ 0.087288)^ 3.009364
The terms are as follows
WS_MPH: Wind speed (miles per hour)
Volts: Output of the wind sensor at the “Out” pin (volts)
Temp_C: Temperature in degrees
ZeroWind_V: Zero wind voltage – measured by angling the sensor at the end of a table with a glass over the end of the sensor (e.g. loop). Wait for the sensor to stabilise for 40 seconds. When the voltage no longer drops and is stable, record the voltage.
Simply substitute 1.3692 for the zero wind speed term. This is the number we used for the regression. Alternatively, you can measure the voltage at zero wind speed on your own sensor and use that voltage. 1.3692 volts is the zero wind data from the original measurement. We measured eight zero wind speed voltages on our current wind sensor and obtained the following graph
1.336 volts
1.332
1.341
1.337
1.327
1.356
1.380
1.361
Its average is 1.346. Measurements using the above method show a similar voltage or the sensor is faulty. This is also at a room temperature of approx. 25°C. The current production appears to be slightly lower than this old data. In order to change the resistance of the selected component to 0.1% Rev. P wind sensor was used and some changes were made to the production. The 0.1% resistors are not available in small quantities for all values. It was therefore necessary to adjust some of the values to get the ratio as close as possible.
This needs to be coded in C. Since most people use microcontrollers with ADCs, we need to enter the reference voltage of the microcontroller and the bit depth of the ADC. For example, for an Arduino UNO or Mega that has a 10 volt ADC and runs at 5.0 volts, replace the term “volts” “(float)analogRead(A0)* 5.0 / 1023.0” with the following equation
VOUT = TC x TA + V0°C。
Where
TA = ambient temperature
VOUT = Sensor output voltage
V0°C = Sensor output voltage at 0°C
TC = temperature coefficient
We need to rearrange this a bit as Vout is known and Tambient is the term we want to resolve.
So we have
Tambient = (Vout – V0°C) / TC
Checking the datasheet, we see that
TC, the temperature coefficient of our component is 19.5 mV/°C
V0°C, the voltage at zero degree C is 400 mV
Therefore the equation becomes
Tambient = (Vout – 0.400) / 0.0195
To check the soundness of the system, we checked a number of sensors and ran their values through the equation, giving 25.0 C and 25.7 C in a comfortable air-conditioned office on a sunny day in August. This is close enough to be relatively accurate. The TempC values in the above regression can be replaced by this equation. It is similar to the above equation for the “volts” output, although you need to read the ADC and convert it to volts.
Warning.
What is life without “if, ands and buts”? The temperature data for which I performed the regression only included a temperature range of 7.7°C and 34. The regression should therefore be somewhat inaccurate at lower temperatures. Fortunately, the temperature does not affect the output so much, so it does not affect the utility of the sensor so much. However, as mentioned earlier, it is possible that some modifications have been made to the sensor since the original data was taken, which may result in other inaccuracies. Ideally, a much wider temperature range and a much wider range of wind speeds would be desired. The data in the regression reaches about 50 MPH. There is probably enough information in the data to allow the curve to extend the measurement somewhat, but if the temperature exceeds 50 MPH from 25°C (particularly cold), there is a greater likelihood of errors in the equation. Above.
Future:.
We are working on a temperature controlled wind tunnel to test the sensor this summer and hope to run it with new data input for the fall. In the meantime we will provide a regression sketch above if it can be completed before the summer trip.

Reviews
There are no reviews yet.